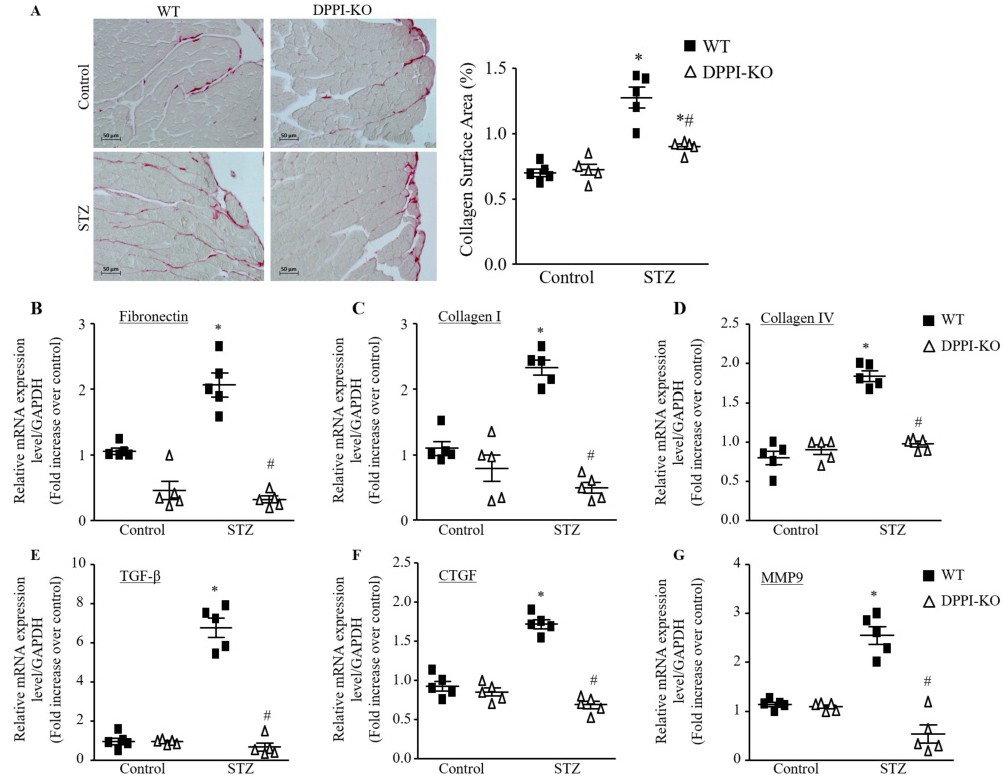
Fig. 5. DPPI deletion attenuated fibrosis induced by T1DM. (A) Histological sections of left ventricular cardiac staining by picrosirius red and semiquantitative analysis was done by a computer imaging system (400X magnification with scale bars 50 µm). (B-G) cardiac mRNA expression of fibronectin (B), collagen I (C), collagen IV (D), TGF-β (E), connective tissue growth factor (CTGF) (F), and MMP9 (G). Data are presented as mean ± SEM. n=5 for each group. *=p< 0.05 vs control and #=p<0.05 vs STZ-treated WT. One-way ANOVA followed by the Tukey post hoc test was used to compare multiple groups.